Odoo already have a tool to profiling the code inside the module. But sometimes we don’t know where the performance issue came from so we can’t just add @profile decorator to every methods we have right?. Then, in this case, there is a tool called py-spy that can attach to Odoo main process directly.
Installation
For most OSes, we can easily install it using pip
python3 -m pip install py-spy
please follow this installation section from py-spy
Usage
We will restrict py-spy in here to record by attaching to Odoo main process ID and check the flamegraph using Speedscope.app. As for details in usage, you can always check it here
After you have installed py-spy, you can always confirm if it installed by using
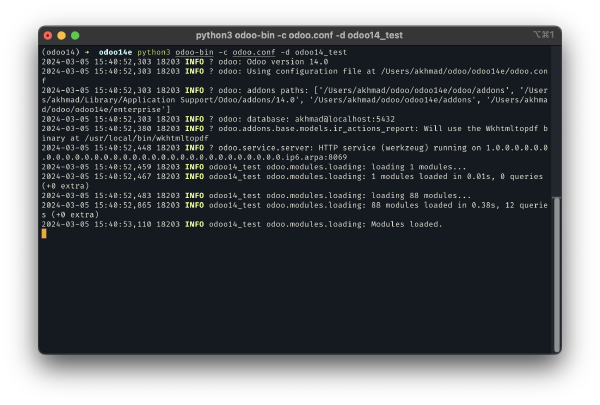
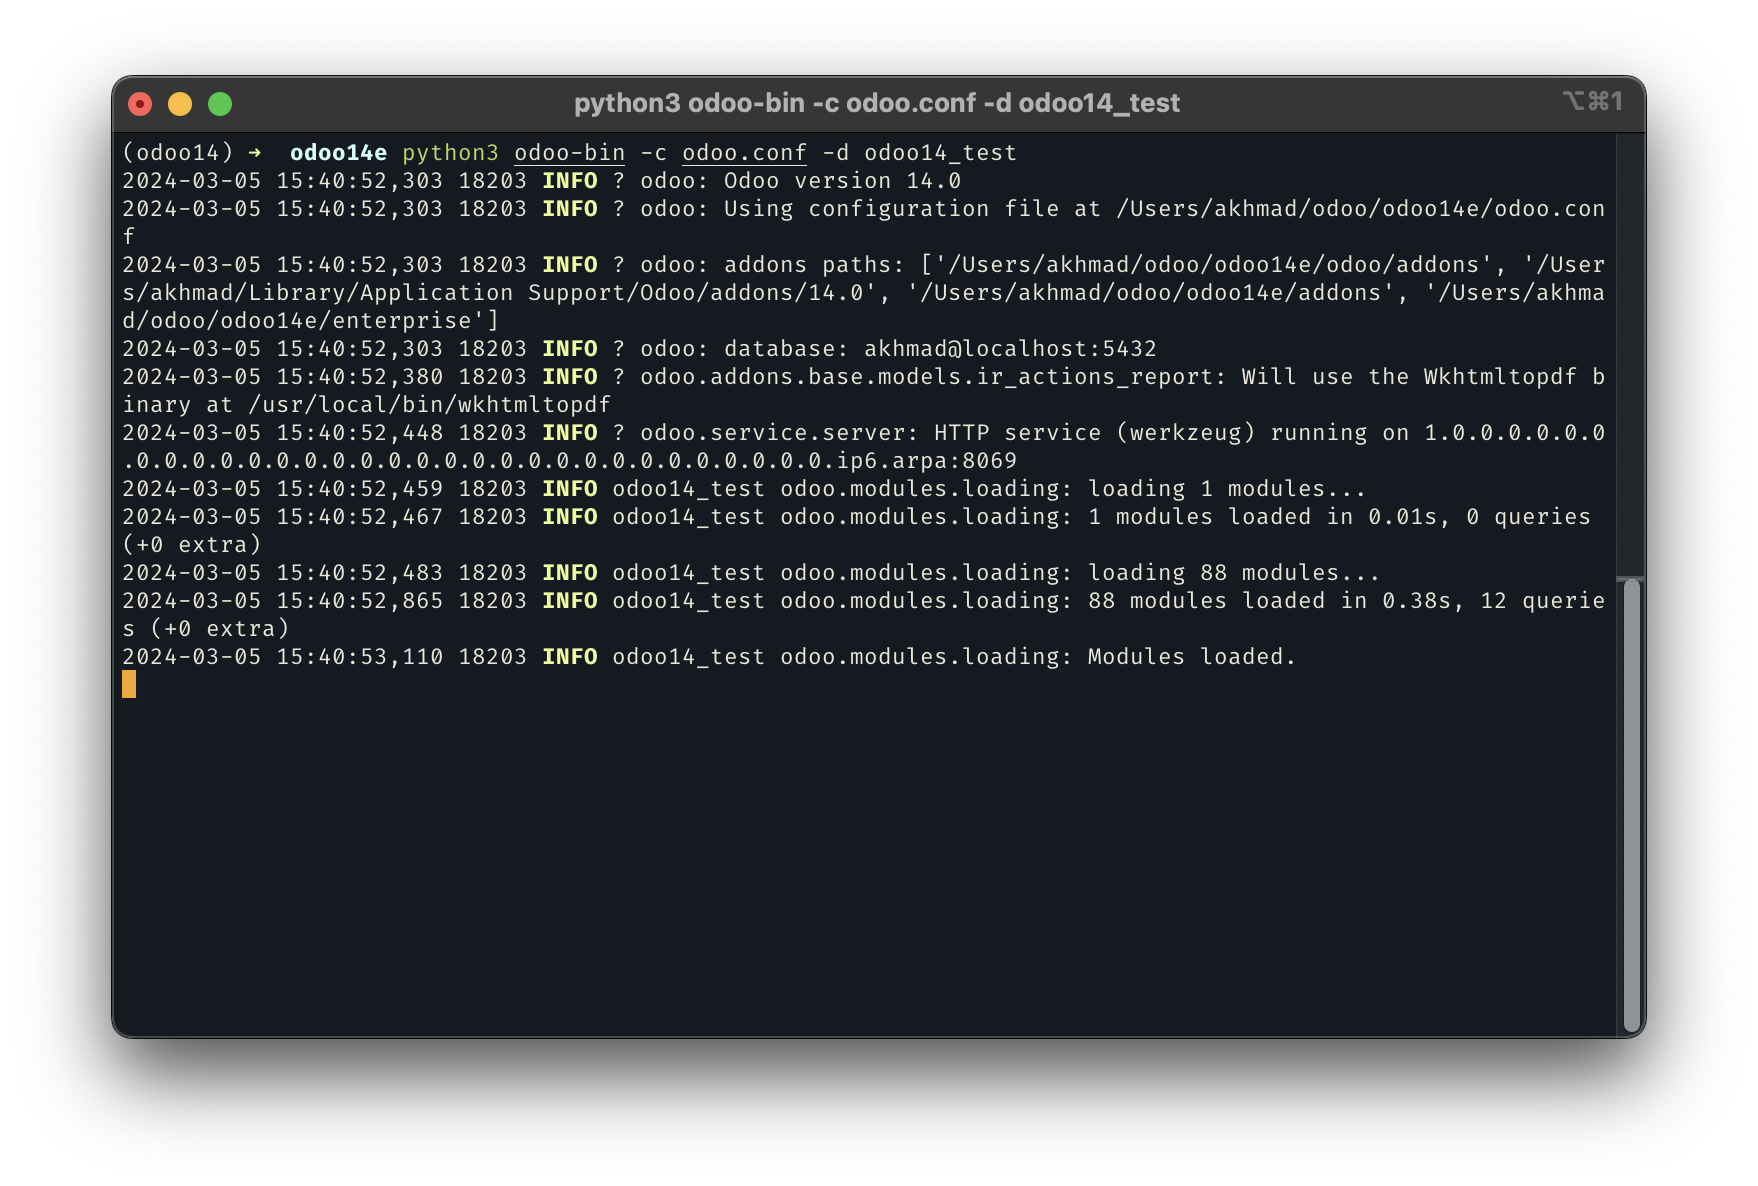
--helpflag$ py-spy --help py-spy 0.3.14 Sampling profiler for Python programs USAGE: py-spy <SUBCOMMAND> OPTIONS: -h, --help Print help information -V, --version Print version information SUBCOMMANDS: record Records stack trace information to a flamegraph, speedscope or raw file top Displays a top like view of functions consuming CPU dump Dumps stack traces for a target program to stdout help Print this message or the help of the given subcommand(s) $Run odoo, in this case, we will run odoo-bin manually inside virtual environment
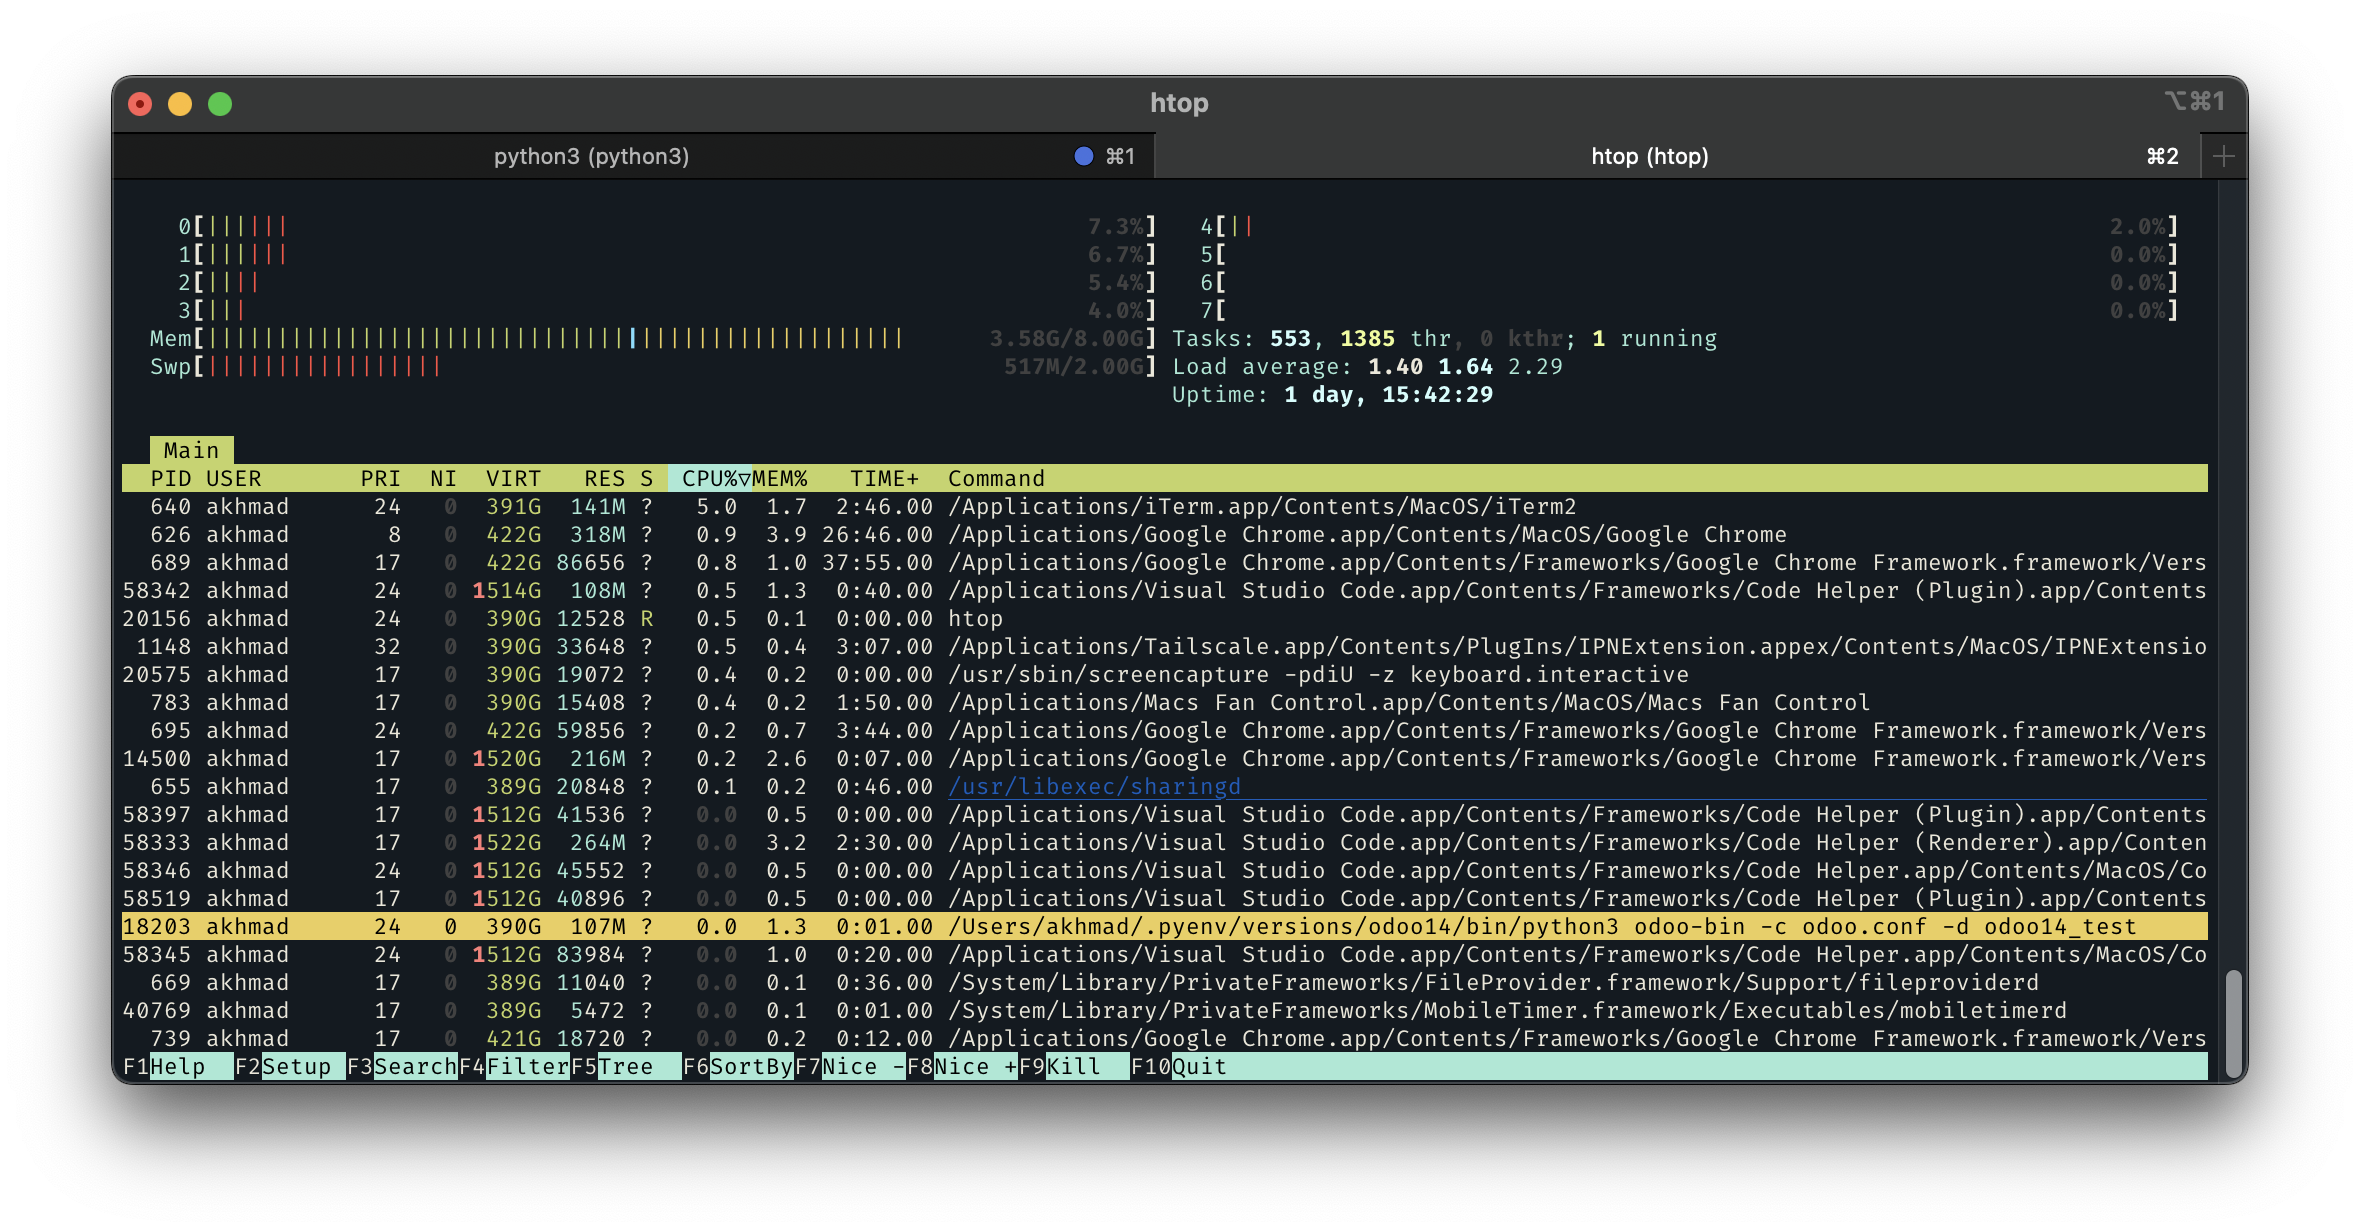
Open new terminal in new tab (or window), then find the process ID. We can use
top, orhtopto find the process and write-down the process ID to run odoo (here we usehtopand using Search function (F3) to findodoo-bin, and found the process ID is18203)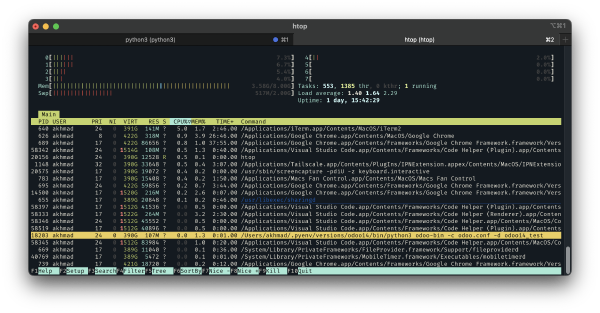
Then close
htop, and run py-spy record while attach to process ID above (you can always check available flags withpy-spy record --help)sudo py-spy record -p 18203 -f speedscope -o odoo-profiling.txtNeed to use
sudosince the process is attaching to the process ID of odooIt will show like this when it is recording. While at it, try some function in odoo (like create Purchase Order, Sales Order, or anything you want to check the traces)
$ sudo py-spy record -p 18203 -f speedscope -o odoo-profiling.txt
py-spy> Sampling process 100 times a second. Press Control-C to exit.
After it’s done, just cancel py-spy process with
CTRL+C, and new file will be created at the same directory you runpy-spy$ sudo py-spy record -p 18203 -f speedscope -o odoo-profiling.txt py-spy> Sampling process 100 times a second. Press Control-C to exit. ^C py-spy> Stopped sampling because Control-C pressed py-spy> Wrote speedscope file to 'odoo-profiling.txt'. Samples: 480 Errors: 1 py-spy> Visit https://www.speedscope.app/ to viewNow, open Speedscope.app and open the file created by
py-spy. There will be so many threads that you can see in the top-center of the page, check one-by-one and look for the method that you know will run when doing the task. Internal odoo is already big even when you don’t have any module installed. So, it will spawn some thread and run some process in different thread or child-process, take your time to find the method and function you sure will run whenever you did the action.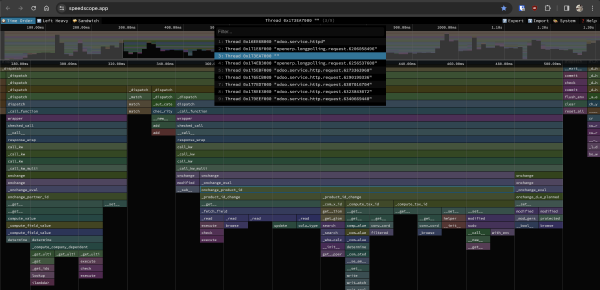
Also in the image above, we can see a flamegraph. You can check this article from webperf.tips on how to read flamegraph.
For example, we know that everytime we create new record in Purchase Order, then add new Order Line and when choosing a product, method
onchange_product_idwill run. We can click the process, and it shown new view at the bottom of the page, this new view shown process before this methodonchange_product_idcalled, and if we see the flamegraph again, there is some methods belowonchange_product_id, this methods (like_product_id_change) will be called whileonchange_product_idrunning.

we can combine py-spy with internal odoo profiler. Py-spy can help to pinpoint the method that takes too much time, then after we know the process, we can use odoo profiler to check the time spent of the process in every line.